

A few weeks ago, I turned off the legacy cardinality estimator on a client’s production database. It’s a database scoped setting (LEGACY_CARDINALITY_ESTIMATION), so no restart, no downtime, just a single ALTER DATABASE SCOPED CONFIGURATION statement.
A week later, nothing had been reported. Users were happy. Job done.
Except “nobody complained” isn’t the same as “nothing changed.” The cardinality estimator drives every row estimate the optimiser makes, and a change to it can silently make some queries faster, some slower, and leave most of them completely untouched. If a handful of queries had quietly got worse, they’d need to be a lot worse before anyone outside of Koderly’s DBA team noticed. I wanted proof, not silence.
Query Store is the obvious tool for this, but it’s also easy to use incorrectly, and I want to show you why, because the naive approach will give you a plausible looking answer that’s actually wrong.
The full script behind this post (linked below) has five sections. This post covers sections 0 and 3 – the pre-flight checks and the actual CE performance comparison. Sections 1 and 2 are diagnostic legwork, confirming which CE model each plan actually used and spotting which plans are new since the change, useful if you want to dig deeper but not the core technique. Section 4 looks at wait stats as a corroborating signal, which is really a separate line of investigation and deserves its own treatment rather than a rushed mention here.
Why a plain before/after date comparison doesn't work
The instinctive move is to pick a date and compare. Either look at SQL Server Management Studio’s built in “Regressed Queries” report or write your own query comparing sys.query_store_runtime_stats before and after the change date.
Here’s the problem – LEGACY_CARDINALITY_ESTIMATION only affects new compilations. If a plan was already sitting in the plan cache and in Query Store when you flipped the setting, it doesn’t get retroactively rebuilt. It just keeps running, under the old CE, until something forces a recompile (e.g. a stats update, a cache eviction, a schema change, sp_recompile).
So, a date-based comparison will quietly compare some queries against themselves. You’ll see identical or near identical numbers either side of the line and conclude “no regression here,” when the truth is that query hasn’t touched the new CE yet at all. On the system I was investigating, nine days after the change, 88.5% of plans with a determinable cardinality model were still running under the legacy estimator. Most of the workload hadn’t been tested by the change yet. A date split would have told me almost nothing.
The fix is to stop asking “what ran before or after this date” and start asking “what actually compiled under which CE model.” That’s a small change in approach with a big effect on correctness.

Section 0: Confirm the change actually took, and that Query Store can see far enough back
Before trusting any of this, check three things: the setting genuinely applied, the compatibility level (which determines what “modern” CE version number you’re actually looking for), and that Query Store’s retention window covers both sides of the change.
					SELECT [name],
       [value],
       [value_for_secondary]
FROM [sys].[database_scoped_configurations]
WHERE [name] = 'LEGACY_CARDINALITY_ESTIMATION';

SELECT [name],
       [compatibility_level]
FROM [sys].[databases]
WHERE [name] = 'YourDatabase';

SELECT [actual_state_desc],
       [current_storage_size_mb],
       [max_storage_size_mb],
       [stale_query_threshold_days],
       [query_capture_mode_desc]
FROM [sys].[database_query_store_options];
One thing worth noting here – stale_query_threshold_days matters more than people expect. Query Store’s cleanup can quietly evict a query_id, and if that same query runs again later it gets assigned a brand new query_id with no link back to its history. Everything in this technique depends on matching query_id across CE models, so if your retention window is short relative to how long you’re waiting for plans to naturally recompile, you’ll lose comparisons you didn’t know you had.

Section 3: Compare by CE model, not by date
The core idea here is that every plan’s XML carries a CardinalityEstimationModelVersion attribute (70 for legacy, your compat level’s number for modern). Read that directly, bucket each plan as Legacy or Modern based on what it actually ran under, then only compare query_ids that have real execution volume in both buckets. Anything that’s only run under one CE model so far gets correctly excluded (since there’s nothing to compare it against yet).
SELECT [p].[plan_id],
       CASE
           WHEN [p].[query_plan] LIKE '%CardinalityEstimationModelVersion="70"%' THEN
               'Legacy'
           WHEN [p].[query_plan] LIKE '%CardinalityEstimationModelVersion="%' THEN
               'Modern'
       END AS [ce_bucket]
FROM [sys].[query_store_plan] AS [p];
From there, the script joins each plan’s bucket to its execution stats in sys.query_store_runtime_stats, and rolls everything up by query_id and bucket, weighted by how often each plan actually ran. It keeps only query_ids that show meaningful volume in both buckets (I used a floor of 30 executions each side). Anything below that threshold isn’t a fair comparison yet, so it gets dropped rather than reported on.
The full script (linked below) also applies this filtering early, before the expensive part, since there’s no point checking a plan’s CE model if its query_id was never going to have enough volume on both sides anyway.
Don't sort by percentage change. Sort by actual impact.
This is the part I’d flag hardest if you build your own version of this. My first pass sorted by percentage change in average duration, and the top result was a query that had regressed 347%. An impressive looking number! Then I looked at the actual figures: 209 microseconds to 936 microseconds. Under a millisecond either way, running 90 times. Statistically dramatic, practically irrelevant.
Meanwhile, further down the percentage sorted list, a different query had gone from 79 milliseconds to 220 milliseconds, a 179% increase, but with CPU time nearly tripling and 453 executions already recorded against the new plan. That’s the one that actually matters, and percentage sorting had buried it.
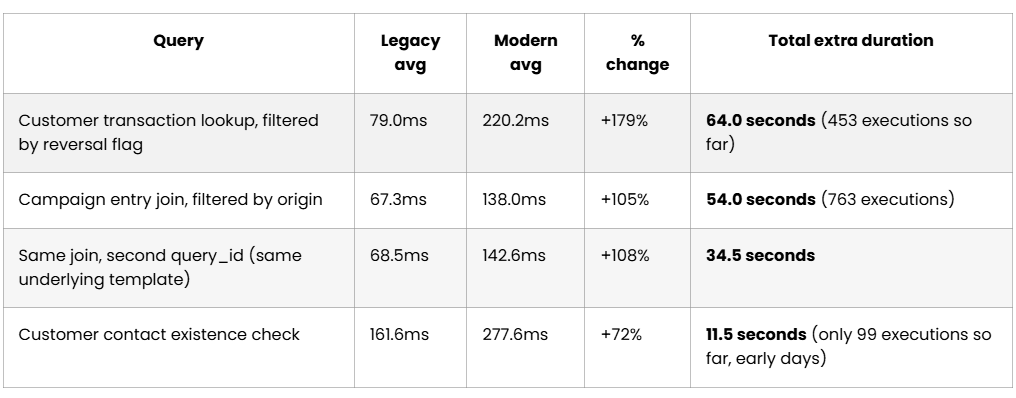
The fix is to rank by total time added, not relative change:
Query | Legacy avg | Modern avg | % change | Total extra duration |
Customer transaction lookup, filtered by reversal flag | 79.0ms | 220.2ms | +179% | 64.0 seconds (453 executions so far) |
Campaign entry join, filtered by origin | 67.3ms | 138.0ms | +105% | 54.0 seconds (763 executions) |
Same join, second query_id (same underlying template) | 68.5ms | 142.6ms | +108% | 34.5 seconds |
Customer contact existence check | 161.6ms | 277.6ms | +72% | 11.5 seconds (only 99 executions so far, early days) |
Against those genuine regressions, several queries improved meaningfully in the same window, including a customer transaction existence check that dropped from 12.9ms to 5.9ms, a 54% improvement. This wasn’t a uniformly bad change. It was a mixed one, with the damage concentrated in a small, identifiable cluster, which is exactly the kind of thing you want a report to surface rather than bury under noise.
One more thing worth tracking separately: CPU impact and duration impact don’t always move together. One query on my list showed almost no change in duration (-0.8%) but had accumulated over 35 seconds of extra CPU time, because its per call CPU cost was already large and it ran over a thousand times. A duration only view would have missed that one entirely. If you’re watching for capacity pressure rather than user facing latency, sort by the CPU column instead.
					-- (per-call increase) x (how many times it's actually run under the new plan)
ROUND((modern_avg_duration_us - legacy_avg_duration_us) * modern_executions / 1000.0, 1)
    AS total_extra_duration_ms

Understanding the output
A few columns are worth explaining properly, because getting the units wrong will send you chasing the wrong queries entirely.
avg_duration_us and avg_cpu_us, from sys.query_store_runtime_stats, are in microseconds, not milliseconds. This trips people up constantly. total_extra_duration_ms and total_extra_cpu_ms convert down to milliseconds for readability, since they’re meant to be read as “how much time has this genuinely cost so far.”
total_extra_duration_ms and total_extra_cpu_ms reflect cost accumulated within the observation window you actually have, not a normalised daily rate. A query that started running under the new plan nine days ago and one that started two days ago aren’t perfectly comparable on raw volume.
What this technique won't catch
I have to be honest about the gaps in this technique. A query_id that gets evicted from Query Store and later reappears gets a new query_id, with no link to its history. So, anything that ages out during a long observation window silently drops out of the comparison. Trivial plans (simple single table lookups that never go through cost based optimisation) never carry a CE model attribute at all, so they’re correctly excluded rather than miscounted, but it’s worth knowing they’re there rather than assuming every unclassified plan is a mystery. Furthermore, early on, most of your workload simply hasn’t recompiled yet. Don’t trust a clean result until you’ve got a decent number of query_ids with volume on both sides of the comparison. I had 18 on day nine, out of over six thousand tracked queries. That’s a start, not a verdict.
Where this leaves me
I’m not reverting the change. The wins outweigh the losses in this case, but the losses are real, concentrated, and now understood. That’s the difference between “nobody’s complained” and “I know what’s happening”.
For the four regressions I’ve named, I’m not touching the database wide setting again. There are two more targeted options, and which one I reach for depends on how urgent the fix is.
Option One
Forcing the plan through Query Store itself, with sp_query_store_force_plan, pointing a specific query_id back at its old, legacy CE plan_id.
It’s fast, it’s reversible, and it buys time to investigate properly without leaving a regression live in production. The downside is it’s a blunt instrument. You’re pinning one query to one plan indefinitely, and if the data shape changes enough that even the old plan stops being right, you won’t get a warning.
Option Two
A query level hint, OPTION (USE HINT(‘FORCE_LEGACY_CARDINALITY_ESTIMATION’)), added directly to the statement.
This is the more precise option. It overrides the CE model for that one query without pinning the plan itself, so the optimiser is still free to choose a different plan later if the data changes, it’ll just keep making that choice under the old CE. Personally, I’d favour this approach over plan forcing whenever I expect the query’s row counts or filters to keep shifting.
Which is best?
Either way, both of these are stopgaps. The real fix is figuring out why the new estimator gets these four queries wrong in the first place, then addressing that directly, whether that’s updating statistics, adding an index, or rewriting the query, rather than propping the database up on the old estimator forever.
The full script is available here: https://github.com/ShaunRAustin/sqlscripts/tree/main/query_store_ce_change_analysis
Thanks for reading.
